Welcome to #DataDecember
We know you love data! And we believe you must have a comfortable start in your journey into data science. Say hello to #DataDecember, a 20-day initiative by LSE’s Data Science Society to provide high-quality, beginner-friendly material to pick up data science concepts.
We value your time as much as we value ours. That means our resources will not involve articles that lack an important learning point. Also, all the material we provide will be what we have already learnt from and summarised. So, you actually are learning from other learners who are able to identify the exact roadblocks you might hit as beginners.
The Philosophy of #DataDecember
At the society, we strive to build a community of data science enthusiasts with the help of active, hands-on learning for students at LSE. This December we wish to revisit fundamental theory, infuse it with hands-on resources and explain relevant concepts as how a beginner would like to perceive it. Being a beginner does pose obvious challenges such as being overwhelmed by the sheer expanse of topics to cover, the ever-persistent impostor syndrome, spurious knowledge and confusion induced by online articles. A good way to tackle these challenges could be to start learning together as a community, guided by steps figured out by fellow beginners and experts alike.
Through #DataDecember, we hope to cultivate a data movement that could help beginners and experts engage with each other and proliferate quality data knowledge.
As Rachel Thomas, co-founder of fast.ai puts it, “You are best positioned to help people one step behind you”. The #DataDecember is our way of believing in that notion and giving back to the constantly evolving and ever-energetic data science community!
How to take part in #DataDecember
The #DataDecember campaign will be run throughout the month of December. We shall continue to post our content here everyday and also engage through our social media handles. You could make things more interesting by engaging with the hashtag on social media and thus contribute to the nest big social media hashtag of our times!
To take part, all you need to do is follow 3 simple steps:
- Follow LSE Data Science Society on our social media channels(check here) if you are not already
- Keep an eye-out on the daily content releases on this official website maintained by the society
- Update your daily/weekly progress on social media using the hashtag #DataDecember
Contributors
#DataDecember has been conceived, operationalized and fueled by the data-related interests of some of us at the society. We would love to have a chat with you if you are interested!
The ones behind the articles
- Ramshankar Yadhunath
- Maja Lie
- Zhen-Yen Chan
- Shahzeb Khan
- Chris Chia
- Mun Fai Chan
- Ximin Chen
- Harish V
Our very hardworking social media team
- Ha Anh Nguyen (Hajni)
- Rachel Soh
- Yuanfeng Li (Cindy)
- Yanjun He (Hedwig)
- Rachel Gaby Aditya
- Isaac Chin
Week 1: Data Science Fundamentals
Topics covered this Week
- What is Data Science?
- The Relevance of Data Science Today
- The Different Components of Data Science
- Common Terms You Would Encounter in your Data Journey
- Data Science in the Real World
Day 1: What is Data Science?
Author: Ramshankar Yadhunath
“Data scientists are kind of like the new Renaissance folks, because data science is inherently multidisciplinary” - John Foreman
In this pilot article for #DataDecember, let’s address the elephant in the room – What is data science?
First, let’s understand what is meant by “data”. Data is essentially a set of characteristics about a particular observation. This observation could be anything that is uniquely identifiable, for example a person or an organization. Think of it like this – When you watch a movie on an over-the-top (OTT) platform, you essentially are acting as an observation and the genres you like watching could be one of your characteristics.
Now, let’s take the idea a level higher. What if the platform wanted to provide you with recommendations that you would want to see? This is where data science begins to show itself. Data about your watching patterns could be analyzed and used to predict how likely you would be to love a new movie X. Based on this, your recommendation list could be created. Sounds easy enough?
A formal definition of data science that is universally accepted is non-existent. However, most of the definitions out there are closely related. For the sake of simplicity, let’s just think of data science as an intersection of statistical skills, computing skills and domain knowledge. While the first two are easy to understand, domain knowledge is not intuitively understood, especially if you are a beginner. Domain knowledge is the knowledge about the kind of data you are working with, including topics such as its origin and the meaning it contributes to the “problem”. The problem refers to the “what you want to achieve” part of your data science project.
What the beginner thinks
Woah! So many articles defining data science in different ways. This is stressful! How do I know what I am learning?
If this sounds like you, don’t worry. This is how every beginner sounds like. Do not bother too much about the definition, unless clear definitions are indispensable parts of what you do. In the simplest sense, think of data science as an endeavour to convert data to value.
References
- Science and data science - PNAS
- The Data Science Venn Diagram - Drew Conway
- Is Data Science A Real Science?. As I hear criticisms about how data… by Ludovic Benistant - Towards Data Science
Day 2: The Relevance of Data Science Today
Author: Maja Lie
“We can only see a short distance ahead, but we can see plenty there that needs to be done” - Alan Turing
The idea of being able to see ahead is a powerful one. Psychologically, humans are not designed to think very long term, so the ability to use data analysis techniques to develop models that can give us some notion of what might occur in the future is extremely useful. That is what data science helps to accomplish. Data science is important because it enables us to take data that is not necessarily interesting on its own and pairs us with tools and methods to transform this data into something insightful. However, not all data science models need to be predictive ones; descriptive models can be useful for identifying why a certain product is not selling as well at a company.
In today’s world, data science is increasingly relevant as the amount of data companies, websites, and other organisations collect on us is exploding. The rise of the internet has led to the easy and rapid collection of people’s personal data: banking information, geographical location, and even what websites and products you click on. This information can drive important business questions. For example, analysing what products are often bought together at a grocery store might influence your local Tesco to change their store layout. If you think about it, data science changes the world around you everywhere. Next time you’re in a store or shopping online, think about how your information might have been used to design a better experience for you as a customer or how advertisements are catered to you.
Because of how powerful data science can be in driving insights which, in turn, often drive profits, the demand for data scientists is high. Even a small amount of knowledge on the subject is desirable and attractive to employers! As students, we are in the perfect time to learn these skills for our future, which is why data science has become such a big buzzword.
What the beginner thinks
Data science is a big, scary buzzword that gets thrown around a lot. What does it actually mean? Do I really need to learn it or is this a trend that is just going to disappear eventually?
As a beginner, I thought all of these things when I first started. The truth is, data science really is important in shaping the world around you. Once I started learning about it, I even noticed it changed how I thought about everyday things. I recommend reading a few articles about real applications to see just how important it truly is. One example is targeted advertising. The next time you go online, take note of what you click on and how advertisements change afterwards. Last week, I bought a Christmas sweater and now my advertisements consist of other Christmas sweaters and clothing. When I was on a health kick, advertisements for different diets and gym clothing were more prevalent. These are small, but important ways in which data science impacts us.
References
- Why Data Science matters
- Using Data Science to Predict Alzheimer’s Risk
- Data Scientist: The Sexiest Job of the 21st Century
Day 3: The Different Components of Data Science
Author: Ramshankar Yadhunath
“The future belongs to those who learn more skills and combine them in creative ways” - Robert Green
In today’s article, let’s explore the different components of data science. In the pilot article, “What is data science?”, we came across the idea that data science is an intersection of stats, coding and domain knowledge. This idea in fact has been adopted from Drew Conway’s representation of data science - The famous data science venn diagram.
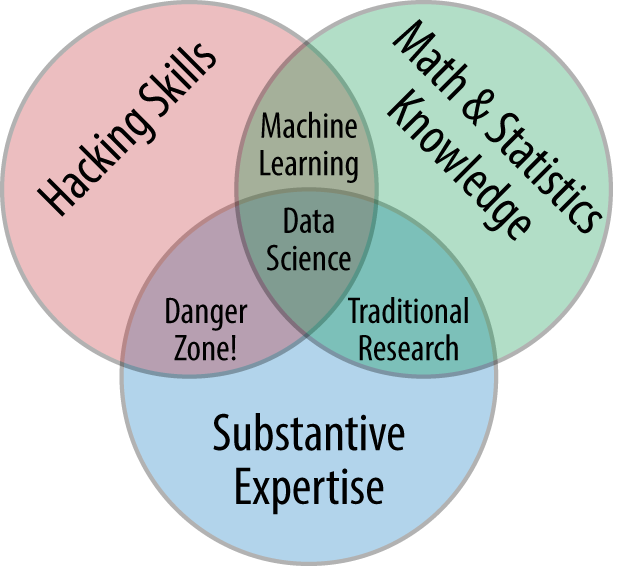
According to this representation, data science is a combination of
- Hacking skills: This helps manipulate all kinds of data, think algorithmically and use computing resources to deal with large amounts of data
- Math and Statistics Knowledge: The tools required to understand the data and extract meaningful insights from it
- Substantive Expertise: The domain-related knowledge that would help make sense of the insights generated in context to the problem being pursued
Having said that, it is now time to address the limitations of this venn diagram representation. A couple of these are:
- The venn diagram does not take into consideration the necessity of soft skills in data science (Source)
- The venn diagram is not an accurate representation of data science in business (Source)
If you are interested in further abstractions concerning a definition of data science, this article could be of help.
What the beginner thinks
So much to learn! How am I going to come to terms with all these multiple components I need?
It’s very common to think this way. But the idea must be to not bother too much about such abstractions. In practice, you essentially only need to know a good deal of statistics, coding ability, domain knowledge and the most important, the drive to deliver value. While the first 2 can be covered through traditional learning, the last 2 will require you to be driven and passionate about the work you are doing.
References
- The Data Science Venn Diagram
- The Essential Data Science Venn Diagram by Andrew Silver - Towards Data Science
Day 4: Common Terms You Would Encounter in Your Data Journey
Author: Zhen-Yen Chan
“Don’t be intimidated by jargon. For example, a model is just a fancy word for ‘recipe’.” - Cassie Kozyrkov
Here are some common terms you are most likely to encounter in your data science journey! These definitions are written for beginners who have little previous exposure to the world of statistics and programming.
Fundamentals
Algorithm: A set of instructions we give a computer so it can turn a given set of inputs into corresponding outputs.
Data Mining / Data Analytics: The process of extracting insights from data and putting it to good use. This includes everything from cleaning and organising the data; to analysing it to find meaningful patterns and connections; to communicating those connections in a way that helps decision-makers improve their product or organisation.
Machine Learning: The process where a system learns from a set of data by studying patterns between inputs and outputs in that data, and then applies those patterns to make predictions with new input data.
Dataset: A collection of data that is used in a particular data science initiative.
Data Science Model: A structure and corresponding interpretation that summarises a set of data, for description or prediction.
Data Science Tools
R: A programming language for statistical computing that is widely used for statistical modelling and data analysis
Python: A general-purpose programming language that can also be used for data science and machine learning
SQL: A programming language used to update and retrieve data from a database
GitHub: A code-sharing and publishing service, and community for developers which provides collaboration features for programming projects
Google Colab: A programming notebook tool that allows people to write and execute Python code through the browser, and is especially suitable for data science and machine learning
Types of Data
Continuous Data: Data that exist as a subset of real numbers, where there is measurable difference between possible values e.g. height, price
Categorical Data: Data that exist as a finite number of discrete values
Time Series: A set of data that is ordered by when each data point occurred, for example temperature throughout a day
Instance (example, record, observation): A single object from the world from which a model will learn from
Feature (attribute, field, variable): A quantity describing an instance
Outcome (label): A dependent variable that the model is used to predict
Missing Values: Values of a feature that are not known or do not exist
Statistical Tools
Correlation: The measure of how much one set of values depends on another. If values increase together, they are positively correlated. If values from one set increases as the other decreases, they are negatively correlated. There is no correlation when a change in one set has nothing to do with a change in the other.
Outlier: A data point that is considered extremely far from other points
Summary Statistics: The measures we use to communicate insights about our data in a simple way. Examples of summary statistics are the mean, median and standard deviation.
Machine Learning Techniques
Supervised Learning: A type of machine learning used to learn the relationship between independent variables and a specified outcome
Regression: a supervised learning problem where the outcome is continuous
Classification: a supervised learning problem where the outcome is categorical
Unsupervised Learning: A type of machine learning used to group data without a pre-specified outcome
Clustering: an unsupervised learning problem which attempts to collect and categorise sets of data into groups that are similar to one another
Deep Learning: A type of machine learning that uses neural networks to solve complex problems, such as natural language processing (analysing text) and computer vision (analysing images)
Stages of a Data Science Project
Extract, Transform, Load (ETL, data engineering): The process of gathering data from different places in a raw form and changing it into a form that is ready for analysis
Data Cleaning / Wrangling: The process of manipulating data to make it usable for your project, for example making values consistent with a larger dataset, removing or replacing missing and incorrect values
Data Exploration: The step where you ask basic questions to understand the context of a dataset, for example by displaying summary statistics and plotting a correlation matrix
Data Visualisation: The art of communicating meaningful data visually. This can involve infographics, traditional plots, or even interactive dashboards.
Feature Engineering: The process of translating knowledge we have as humans and translating it into a quantitative value that a computer can understand. For example, we can translate our visual understanding of the image of a mug into a representation of pixel intensities.
Training and Testing: When building predictive models, you first train the model on training data so that it can build understanding. Then, you test the model on test data where it applies its understanding and makes predictions.
Feature Selection: The process of identifying which features are the most valuable when building a model.
Overfitting: Happens when a model considers too much information from its training data that it fails to predict new data reliably
Model Deployment: Applying the model to real data to form a use case
What the beginner thinks
It can feel intimidating to have so many new terms to learn! Don’t worry about having to remember or fully understand these definitions right away. Machine learning models are, after all, just “thing labellers’’. Learning the meanings of these words will help you get through your first data science book or online course. But more importantly, it’s what you do with this new knowledge that matters. By the end of your first project, you’ll have come across these terms so often that you’ll be able to come up with your own analogies to explain them to other data science beginners. I’ll leave you with one of my favourite videos explaining the concept of machine learning with the analogy of using a microwave to make pizza. Happy coding, young padawan!
References
- Data Science Terms and Jargon: A Glossary
- 25 Terms Every Data Scientist Should Know
- Glossary of Terms Journal of Machine Learning
Day 5: Data Science in the Real World
Author: Maja Lie
“Work gives you meaning and purpose, and life is empty without it” - Stephen Hawking
In today’s content, let’s dive into where data science is used currently and provide a few examples about the kind of high impact value that this field can deliver. Here are 3 short cases:
Covid-19
Data science was behind many of the public health mandates that have risen out of the Covid-19 crisis; for example, decisions to lock down, wear masks, and social distance were made from analyses done on huge data sets about covid transmission rates and the behaviour of people worldwide. Data science models can allow us to predict how the virus might spread and which areas are most vulnerable. This allows us to prepare PPE ahead of time for these areas so the impact of the virus can be mitigated. The biggest challenge in these analyses is linking the data together in a meaningful way from several different sources.
London Transport
We’ve all been in an overcrowded Tube car during rush hour, but believe it or not, TfL does actively try to use data science to reduce this issue. Data scientists at TfL use ticketing data from entrances and exits at Tube stops to see how people use the transportation network. This data can be used to determine what stops are the most popular, what the busiest times are at each stop, and even how ridership changes due to weather. Using this information, TfL can then use this information to determine how frequent lines run and other design mechanisms to alleviate wait times and overcrowding.
Stock Market
Lots of things can impact the stock market: news headlines, natural disasters, political atmosphere, etc. Data science is frequently used to do time series analysis about the trend of the stock market over time. In more sophisticated models, we can even predict how stocks will respond to specific news. We can also use classification models in data science to decide if a stock is a good investment or not based on certain criteria(like P/E ratio).
Now, data science is not limited to a specific dicsipline at all. Remember from day 1 that “domain knowledge” is an integral part of data science? This domain knowledge is nothing but what you need to know about an area you are going to work on!
What the beginner thinks
When I was a beginner, I was interested in cryptography, health economics, and education policies. My first thought when I was beginning to learn data science was: how can I apply this to an area of my interest? My recommendation is to think about your interests and how data science might fit into them, then look up a few articles related to it. It might reignite your interest in both the subject and data science!
References
- OxCovid19 Project
- How TfL is using data science to reduce station overcrowding and closures
- How to Use Data Science on the Stock Market
Week 2: Statistics and Math
Topics covered this Week
- Descriptive Statistics
- Inferential Statistics I
- Inferential Statistics II
- Statistical Tests
- Linear Algebra and Calculus
Day 6: Descriptive Statistics
Author: Maja Lie
“Factfulness is … recognizing that a single perspective can limit your imagination, and remembering that it is better to look at problems from many angles to get a more accurate understanding and find practical solutions.” - Hans Rosling
Descriptive statistics is helpful to understand key features of your data set. It is about describing and summarizing data through important statistics such as mean and variance. When you are carrying out descriptive statistical analyses, it’s important to take note of a few things. The first thing you should look at is the distribution of your data. For example, a lot of data is normally distributed, which is a very popular distribution. This distribution is bell-shaped and symmetric with tails at both ends. Second, you should take note of statistics such as the mean, which is the average, and measures of variability like variance or standard deviation. Measures of variability show us how dispersed our data set is from the mean. Additionally, you can look at graphing your data set to see if there’s any kind of linear relationship or non linear relationship.
Similary, there are many other descriptive analyses you can do, but the important thing is you should do them. Doing this before starting a project can reveal information about your data that might influence the type of model you decide to create or give you an idea of what the most suitable analysis would be.
What the beginner thinks
I know what a mean is! As a beginner, you probably already know quite a bit of descriptive statistics without realising it. A great refresher would be to refamiliarise yourself with the definitions of mean, standard deviation, and the properties of important distributions. Check out ST202 at LSE! Or the internet has endless resources and beginners’ courses that are short and quick.
References
Day 7: Inferential Statistics - I
Author: Shahzeb Khan
“There are two kinds of statistics, the kind you look up and the kind you make up.” - Rex Stout
Inferential statistics covers how you can use the data you’ve gathered to make predictions about bigger populations which your data doesn’t cover. For example, you’ve carried out a survey in a small village and have gathered figures about the annual income of all the residents. Moreover, you also calculated the average income for all the residents. Great, but can you infer anything about the average income of the entire country which the village resides in? Or can you calculate the variance? Inferential statistics equips you with tools to carry out such analysis.
The reason this topic is widely regarded in statistics is because it is often difficult and expensive to gather data on millions of people. So, using inferential statistics, you can carry out your experiment on a small sample of people and use it to estimate how the population in general behaves.
You can see inferential statistics being used just about anywhere you have to carry out analysis of data and so you might even already have some experience of using it. Since it is such an important topic, we’ve decided to split it into two parts. The first part will provide resources that cover statistical probability distributions (these distributions represent the population of your data) and some sampling techniques which are used in collecting data. The second part will talk about estimation techniques, such as the Central Limit Theorem, and confidence intervals.
What the beginner thinks
Wait, I do know a fair bit of this. Then what’s holding me back from executing it in a project?
Like with descriptive statistics, even a beginner might already be familiar with some of the topics covered. However, most of the hurdle lies in translating what you’ve learnt into actual executable code. So, it is crucial to know the topic inside and out so that you can easily implement it into a programming language. Even if you already know the topics, it is still a good idea to brush up on some of them. The internet provides vast resources for you to do this, or, if you’re really interested, you can audit the ST102/ST202 courses in LSE.
References
- Introduction to Inferential Statistics
- Probability Distributions in Python
- Introduction to sampling methods
- Using sampling techniques in Python
Day 8: Inferential Statistics - II
Author: Shahzeb Khan
“Facts are stubborn, but statistics are more pliable” - Mark Twain
In the last article we covered introduced inferential statistics and the type of analysis you can carry out using it. In this article, we will go into detail about how you can carry out this analysis. Specifically we will talk about the Central Limit Theorem (CLT), its uses and applications, and confidence intervals (how confident you can be in the analysis you carry out).
So what is the CLT? Well it is a theorem that establishes that in many scenarios, random variables tend to a normal distribution even if the random variable is not itself normally distributed. For example, let’s say you generate a random number from some Poisson distribution. CLT tells you that if you generate enough random numbers from this Poisson distribution, they will start to take the shape of a normal distribution. To get a visual understanding, take a look at this demonstration. Another way to look at it is that if you take enough samples from a population, CLT states that the graph of sample means will look more like a normal distribution. (Don’t worry if you don’t get this right now! More explanation will be provided in the resources.)
Now that you have a guess for the population mean, how sure can you be in your guess? Using confidence intervals, you can quantify just how importance you should place in your guess. A confidence interval gives you an interval of values around your guess and tells you what is the probability of the true parameter being within this interval.
What the beginner thinks
“There’s too much maths and stats, I’m getting overwhelmed!”
If you’re one of the many people thinking this then don’t worry! It is perfectly normal to feel this way and no one expects you to understand everything at once. Actually, instead of dropping everything to learn all these concepts, it is better to approach them in bits and pieces. Set aside a few hours every week where you can study these topics in detail and in the rest of your time focus on the other sides of data science (such as coding). The good news is that Python already contains many libraries which implement these advanced concepts in just a few lines of code. Meaning, you don’t even need to know how something works to make use of it. Still, it is advisable that you go through the topics listed as when something doesn’t work, and it will eventually, you will be able to tell exactly what and why.
References
- Khan Academy: Central Limit Theorem
- Khan Academy: Confidence Intervals
- Visualizing Central Limit Theorem in Python
- Confidence Intervals in Python
Day 9: Statistical Tests
Author: Ramshankar Yadhunath
“A judicious man looks on statistics not to get knowledge, but to save himself from having ignorance foisted on him.” - Thomas Carlyle
The core of data science is in its ability to help us make decisions and interpret these in ways that would help others understand them. In its most basic form, a visualization could help us make decisions. For example, a scatter plot could help identify to an extent whether there is a relationship between 2 variables or not. However, when the stakes are higher, there naturally arises a need to have more complex methods to judge the usefulness of a decision. This is where the concept of statistical tests comes into the picture.
Statistical tests are not the easiest concepts to pick up and hence the 500 word summary here might most likely be not enough to help you understand all of it. However, I shall try to put the first ideas in perspective here.
Let’s take this from the start. A statistical test is fundamentally a tool to make better decisions or understand our assumptions. Therefore, the first step in a test is to clearly define assumptions. In a statistical hypothesis test, you have 2 assumptions – The null hypothesis(H0) and the alternate hypothesis(H1). The null is usually what you don’t want and the alternate is what you want to happen. If the null hypothesis is false(rejected), only then does the alternate hypothesis occur. The next question then is how do we know whether to reject or fail to reject the null hypothesis? For this, the test requires us to calculate something called a test statistic. Think of it as a single value representing some data in question. This test statistic is used to calculate a p-value. At this point, think of the p-value as a measure that is used along with a significance level to reject or fail to reject the null hypothesis. If a p-value is less than the significance level, then we say that “The null hypothesis has been rejected at the given significance level”. Obviously, if the p-value is greater than a given significance level, then the null hypothesis cannot be rejected at the given significance level.
What the beginner thinks
“I still don’t know what a statistical test is even after going through this again and again!”
Well, we have all been there. To be honest, I still get confused with the process. But, here is the truth – The only way to get familiar with these is to practice their use. For example, while the main framework seems simple, statistical tests can be of many different types. Using them in a project is what would help understand their components in better fashion. There are different kinds of statistical tests, but it is not that hard to know which one to use for what problem once you have a table such as the one presented here.
Also, all data science is definitely not dependent on statistical tests. However, I would argue that statistical tests are one of the most important parts of data science, if not the most.
References
- What are statistical tests? (nist.gov)
- Statistical testing - Understanding when to use which one? (datascience.foundation)
- A Gentle Introduction to Statistical Hypothesis Testing (machinelearningmastery.com)
Day 10: Linear Algebra and Calculus
Author: Shahzeb Khan
“Mathematics requires a small dose, not of genius, but of an imaginative freedom which, in a larger dose, would be insanity.” - Angus K. Rodgers
‘I understand why we need to learn statistics,’ I hear you saying, ‘but why on earth would we ever need to learn mathematics to become data scientists?’ Good question and one whose answer isn’t obvious at first. When you work as a data scientist, a lot of your work does revolve around on creating graphs and managing datasets, but you also need to perform analysis on your data as well. In the last article we saw how you can use inferential statistics to do this but another way is to use certain Machine Learning (ML) algorithms. These algorithms can help you generate predictions, classify objects and find patterns in your data. And so, in order to understand these algorithms, it is vital that you know some mathematics - specifically linear algebra and calculus.
Linear Algebra is a branch of mathematics that deals with linear equations and how these equations can be represented through matrices and vector maps. Calculus is the study of continuous changes (think of differentiation and integration). Put them together and you are now able to understand how ML algorithms, such as neural networks, function.
What the beginner thinks
Before you begin your journey of studying Linear Algebra and Calculus, I have to be frank with you, it is going to be an extremely long and difficult path. Infact, in just the few links I have provided above, I have already given you dozens of hours of material and they don’t even scratch the surface. So before you jump into the jungle of mathematics, thinking that you can simply breeze through these topics, just brace yourself. I want to assure you that it is okay to spend weeks, and even months, on certain topics; no one expects you to perfectly understand everything on your first try. In fact the beauty of programming is that you don’t even need to understand something in detail to be able to use it in code (due to the presence of libraries).
References
- Introduction to Machine Learning (covers how Linear Algebra and Calculus are used to build ML algorithms as well as other knowledge)
- Essence of Linear Algebra (a video series which aims at providing a geometric understanding of Linear Algebra)
- Introduction to Mathematics in Data Science (contains many follow-up links)
Week 3: Computer Programming for Data Science
Topics covered this Week
- Brief Intro to Computer Programming
- The Data Science Stack - Python and R
- Brief Intro to sQL
- Microsoft Excel for Data Science
- Data Science on the Cloud
Day 11: Brief Intro to Computer Programming
Author: Ramshankar Yadhunath
“Programming is the art of telling another human being what one wants the computer to do.” - Donald E. Knuth
There are many independent arguments about why one should learn to program in general, however in this section I shall talk about programming in the context of data science projects. The ability to write code and interact with data via computers is an essential part of modern data science. Programming is a tool in the data science workflow that pops up in essentially every step of a project.
The key to a good computer program is efficient problem defining and problem solving. For example, if you are analysing a dataset containing tweets by a political party, then you must realise that the first step involved would be to ensure that you clean the dataset. For doing this, you write code but before writing code, you must first understand what you want your clean dataset to look like!
After deciding on how exactly you must solve your problem, the next step is writing the actual code. Now here, there is one skill that is possibly more important than any other – The ability to read official documentation. Official documentation is a document maintained by programming languages or libraries that house everything you need to know to use that language or library. Of course, to a beginner these docs might appear too scary. However, if you are able to master the skill of reading documentation, then writing code becomes a whole lot easier and faster.
At this juncture, I would like to lay emphasis on the idea that, “Writing code that can be read and understood in the future by the original programmer or another is as important as writing code that works”. The use of appropriate comments and providing extra documentation where necessary is one way to ensure your code is readable.
The 3 main points discussed above are in no ways comprehensive as far as computer programming is concerned. However, keeping these 3 points in your mind at all times will most likely save you a lot many hours of time when working on data science projects!
What the beginner thinks
“I have never programmed. It looks so difficult.”
The prospect of learning an entire new language is always difficult. But, that does not mean it can’t be done. Computer programming revolves around a few important concepts that are freely available on the internet. Once these concepts are covered, it does not really matter what programming language you choose as long as you get the job done. And in this case, getting the job done refers to completing your data science project in a way that it adds value to your stakeholders.
I highly recommend this book Structure and Interpretation of Computer Programs (mit.edu) if you are a complete beginner to computer programming.
References
- Introduction to Computer Science and Programming - MIT OpenCourseWare
- Computer Programming as an Art by Donald E. Knuth
- A Gentler Introduction to Programming (freecodecamp.org)
Day 12: The Data Science Stack - Python and R
Author: Zhen-Yen Chan
“Thanks to big data, machines can now be programmed to do the next thing right. But only humans can do the next right thing.” - Dov Seidman
In previous articles, we have talked about computer programming as a tool that helps us manipulate large amounts of data to extract insights which add value to stakeholders. This article introduces two of the most popular programming languages that have powered data science in the last two decades - Python and R.
Python and R are preferred over other programming languages because they have many packages and libraries (collections of algorithms) that simplify data science tasks. They also have massive global communities - for any problem you encounter, hundreds of people have probably asked the same question and got answers online, on platforms such as Stack Overflow (every programmer’s best friend). Below, I summarise some insights into which one might be better for your needs, as well as recommend some resources to get started with both languages.
Python
Python is a general-purpose programming language that has many uses along with data science and statistics. Being general-purpose means it allows you to do “almost anything you can imagine” - websites, desktop applications, machine learning pipelines, data engineering systems and more. The biggest advantage of Python is the readability and simplicity of its syntax which is similar to written English, making scripts intuitive and accessible for people who are completely new to programming.
According to Stack Overflow and Kaggle surveys in 2019, Python is more widely used than R, although both languages are important among the data science community. If you are looking to get into programming in general, Python seems to be a better choice as it can be used in other areas of software development such as web development. If you need to share your analysis with other technical people, it might be good to use Python along with Jupyter Notebooks and Google Colaboratory, which allow you to display outputs between your code.
If you need to develop APIs for your models to interact with other applications, Python allows you to deploy your models with simple APIs like Flask or build full-blown web applications with Django that can easily integrate into companies’ production systems. Most deep learning research and tools like Keras and PyTorch are also developed in Python, which are useful when you’re doing more advanced projects with neural networks.
My top picks: Python learning resources for beginners
- “Take your first steps with Python” by Microsoft is a free 5-hour course that introduces basic syntax and how to think like a programmer.
- “Foundations of data science” by Microsoft and UC Berkeley, is a free 13-hour course.
- Python for Data Analysis by Wes McKinney is a practical textbook that is good for building foundations.
- Guide to data mining - an introductory guide to machine learning with Python code and a sense of humour!
- For LSE students: ST101 Programming for Data Science - a half-unit course with Python first introduced in Lent Term 2020/21.
R
R is a programming language specialised for statistical computing and graphics. It has a huge number of popular statistical packages (more than Python, though Python is catching up), such as tidyverse which helps with end-to-end data manipulation and visualisation, which makes it very useful for statisticians, economists, and social scientists.
If you want to build quick dashboards for non-technical stakeholders, it’s a good idea to utilise R with its amazing Shiny library. If you are already familiar with scientific programming languages like MATLAB, it might be easier to learn R as those languages are very similar.
If you’d prefer to have all your packages handy and mainly focus on your analysis for decision-making, R might be the go-to tool. Thanks to RStudio - a well-designed environment with features such as syntax highlighting, integrated documentation and debuggers, going from raw data to analysis with visualisations without leaving your window makes it the simplest setup to get started with.
*Even though Python is easy to get started with as well, throughout the years it has evolved into different versions and setups, which has caused me small problems when setting up on my computer as I did more projects!
My top picks: R learning resources for beginners
- “R Programming” by Johns Hopkins University on Coursera is a comprehensive 57-hour course (you don’t need to complete it to get started on your first project!).
- R for Data Science by Wickham and Grolemund is a textbook which introduces R, RStudio and tidyverse designed for complete beginners looking to learn data science as quickly as possible.
- An Introduction to Statistical Learning with Applications in R by James, Witten, Hastie and Tibshirani, is a classic textbook well-known in the data science community as ISLR. It introduces machine learning with clear math and R code and is my personal favourite!
- For LSE students: ST211 Applied Regression is great for building foundations in statistical thinking. ST309 Elementary Data Analytics covers most concepts in ISLR. ST309 students also get access to a free DataCamp license to learn R, which you can use for a whole year!
What the beginner thinks
“They both sound amazing, I still don’t know which one I should learn!”
Regardless of which one you invest your time in learning, both Python and R are powerful languages that will serve you well. Many data scientists learn both languages to combine their capabilities and utilise the best of both worlds. However, you might have some trouble differentiating certain syntax if you keep switching between the two. My advice would be to just pick one and get started! You can consider learning the other if you become interested in a long-term career in data science (or when a module at university requires you to learn it).
Also note that given the rate that technology is evolving, it seems likely that a new and more efficient language will be developed to replace Python and R in popularity within the next decade. But don’t worry, the fundamental programming concepts gained from learning either Python or R will make it easy for you to learn a second programming language whenever you need to.
Thanks for reading this far and all the best to those of you who are starting your coding journey in 2021. :) For LSESU Data Science Society members: be sure to utilise our Zulip workspace - our internal community platform for people to find teams, ask coding questions and support each other. The link to join can be found in our weekly society newsletters.
Merry Christmas and happy coding, young padawan!
References
- Python vs R for Data Science
- R or Python? Why Not Both?
- Python vs. R for Data Science: What’s the Difference?
- Kaggle Survey 2019 Dashboard
Day 13: Brief Intro to SQL
Author: Maja Lie
“I am never so happy as when I am really engaged in good earnest; & it makes me most wonderfully cheery & merry at other times which is curious & very satisfactory.” - Ada Lovelace
What is SQL? Well, technically it stands for Structured Query Language. SQL is a programming language that can execute queries against a database to retrieve data, add data, update data, and perform other manipulations to data. There are a few key commands in SQL such as SELECT * FROM which allows you to select all of the columns from a specified data table. You can also group data by certain characteristics to select data that meets a criteria. Like in any other programming language, you can write conditional statements to filter out data.
In finance and countless other industries, banks and financial services companies use SQL to process huge customer databases. They may use SQL to group their information by their customers’ geographical location or account types. Once you process this data, you can use the data to create visualisations in Tableau or even use SQL within Python. Python has the ability to execute SQL queries using MySQL. The benefit of SQL is it’s a very powerful data organisational tool and being able to use it is highly sought out by employers, plus it’s not hard to pick up! When you start out, you will usually only use a few key commands, but these commands can accomplish a lot.
What the beginner thinks
“All these employers say they want SQL, so I should probably learn what it is.”
First of all, it’s pronounced “sequel”. Second, you should start learning SQL by familiarising yourself with the most used commands first. Here are some of them:
SELECT - extracts data from a database
UPDATE - updates data in a database
DELETE - deletes data from a database
INSERT INTO - inserts new data into a database
CREATE DATABASE - creates a new database
ALTER DATABASE - modifies a database
CREATE TABLE - creates a new table
ALTER TABLE - modifies a table
DROP TABLE - deletes a table
CREATE INDEX - creates an index (search key)
DROP INDEX - deletes an index
Then experiment! Hands on learning is the best way to get better at SQL.
References
Day 14: Microsoft Excel for Data Science
Author: Zhen-Yen Chan
“Data science is about combining the tools best suited to get the job done.” - Rashi Desai
I’m not afraid to admit that I love organising my life in spreadsheets. I use them for everything from planning my budget and revision schedule to managing LSESU Data Science Society’s workflows. In today’s article, I discuss some pros and cons of one of the longest-standing tools that can help us in data science, and also point to some resources for anyone interested in learning data analysis skills on Excel.
Often overlooked in the data science community, Microsoft Excel is probably the best and most well-known tool for working with 2-dimensional data (tables with rows and columns). It’s so much easier to edit, format and share tables in Excel than, say, Python or R. Google Sheets is also amazing because it scales the design of Excel to allow multiple users to edit simultaneously. Pivot tables and charts are powerful tools for data analysis, along with data cleaning and text processing functions like Remove Duplicate Values, Text to Columns, Vlookup(), Concatenate() and Trim(). Furthermore, the built-in database engine can execute SQL queries, and the Power Query editor can connect to data sources on the Cloud. Excel’s Analysis ToolPak can perform regression and statistical testing, and the Solver tool can be used to create deep learning models (that are slow and inefficient, but work the same).
While Analysis ToolPak allows us to do machine learning on Excel, it is cumbersome to adapt your models with hard-coded functions in VBA. Hence, most data scientists prefer Python or R for their open libraries and transparency, as well as their larger data capacity. At the time of writing, Excel has a limit of 1,048,576 rows and 16,384 columns per sheet. This is often enough for most personal and commercial needs for editing and exploring data, but is not very impressive for Big Data such as social media datasets with a few million rows. Excel is also far behind in data visualisation capability compared to libraries like R’s ggplot and Python’s matplotlib. Finally, it is difficult to track how you manipulate data from beginning to end in Excel unlike in Python and R scripts - so that others can repeat and verify your work.
My top picks: Excel learning resources for beginners
- “Learning Excel: Data Analysis” on LinkedIn Learning is a free 2-hour tutorial that teaches basic statistics concepts applied using data analysis and visualisation tools on Excel
- Learn Data Mining through Excel by Hong Zhou is a quick read that takes you through the basics of machine learning and implements them with Excel.
What the beginner thinks
“I already know Excel, so it seems less intimidating than learning to code.”
The simplicity of Excel allows you to get started with data manipulation quickly and easily, making it accessible to less technical people looking to understand their organisation’s data. While Excel cannot replace Python/R machine learning, it is a great window to learn the workings of algorithms and solve many problems without writing a line of code. Data science is always about combining the tools best suited to get the job done. On some days, Excel would be your go-to for quick pivots and charts, on other days you’d need to code to reveal deeper insights, and someday you might decide to combine the capabilities of both. Keep excelling, young padawan!
References
- Excel for Data Science?
- An introduction to data science and machine learning with Microsoft Excel
- 10+ Simple Yet Powerful Excel Tricks for Data Analysis
Day 15: Data Science on the Cloud
Author: Chris Chia
“I don’t need a hard disk in my computer if I can get to the server faster… carrying around these non-connected computers is byzantine by comparison.” - Steve Jobs
Much of Data Science, as a student seems to be done in Jupyter Notebooks and locally downloaded .csv files. However in a “real world” setting, you may be tasked to source data from the company’s database, or presented with datasets that are simply too large to fit into memory - “Big Data”! How can you train a model, do visualisations, and analyse the data if you can’t even load the dataset?
These are some examples where “the cloud” might come into play. In one sentence, cloud computing represents on-demand computing resources available somewhere else - for example storage (e.g. of large datasets) and computational (e.g. to train deep learning models). The most well known cloud computing platforms are Amazon Web Services (AWS), Google Cloud Platform (GCP), and Microsoft Azure.
Some use cases
Cloud Databases / Persistence
Beyond being able to store datasets being too large for your computer, cloud databases may also be helpful in allowing dynamic real-time updates - your dataset may be changing daily - and sharing access to data with your collaborators, but with the added advantage of not having to configure the database too much yourself. Some tools that could help with this are: Google’s Firebase and AWS S3
Pre-existing Models/APIs for Computer Vision, NLP
Cloud platforms also allow you to train models, but maybe you have some Computer Vision or NLP task. Instead of training a model from scratch, you could consider some of the existing solutions offered, for example AWS Rekognition, GCP’s Natural Language API etc.
Web Applications
After your research, you have created a solution in the form of a web app or dashboard (perhaps using Streamlit, R Shiny, Dash/Plotly). Maybe you want to display it on the internet so others can view your work. Some tools to do this are Heroku and AWS Elastic Compute 2 (EC2)
What the beginner thinks
“Why should I learn about Data Science & Cloud? It works fine in my Jupyter Notebook”
Familiarity with Cloud Computing is not only helpful in “Big Data” scenarios, but also in “small data” (e.g. student projects!); the cloud platforms provide a lot of tools that can bootstrap your data science projects (see below).
Finally, learning about Cloud & Data Science is helpful if you want to be a Data Scientist or Software Engineer / Data Engineer. Or maybe you are a social scientist who is tasked with analysing a massive dataset, or working as a financial industry professional who has to analyse a massive financial time-series dataset. Regardless, there is value in learning about cloud computing & data science.
Getting started
There are no definitive guides to data science on the cloud, given the breadth of the tools available. A variety of information is usually available in the documentation, and online articles/videos/courses. As usual, a good way to get started is to work on a project, and in doing so learn the appropriate tools for the task - one example could be to use AWS Lambda to scrape some data daily, store it on AWS S3, and deploy the final web app on EC2.
Finally, watch out for those AWS charges - Silicon Valley S04E04
Week 4: Working on a Data Science Project
Topics covered this Week
- Problem Formulation and Data Acquisition
- Data Cleaning
- Data Exploration
- Building Models
- Presentation of Your Project
Day 16: Problem Formulation and Data Acquisition
Author: Maja Lie
“Life is not easy for any of us. But what of that? We must have perseverance and above all confidence in ourselves.” - Marie Curie
Formulating your question when designing an experiment is the first step and one of the most important parts of your experimental design. This question will drive all other parts of your experiment, including what analysis you use and how you collect data.
Usually, you will already have a problem in mind to tackle. First, you need to ask a question that is specific enough to be new and interesting (you don’t want to ask a question that a million people have already answered) but broad enough so that you will actually be able to find data to use (unless you are collecting your own data). Second, you need to collect data that is relevant to the question you’re trying to answer. For example, say we are Tesco and our question is what products do shoppers buy frequently together. We want to find this out so we can change the layout of our store to place these products at opposite ends of the store, forcing the customer to go through the entire store. We hope this will improve profits; customers walking through the store might see something else and purchase that as well. Collecting data on customers’ nationality might not be important to us in this case, but knowing if a customer has a small baby might. They will purchase more baby food products and diapers. We can acquire our data by either conducting our own experiment or searching online for existing databases. If you use an experiment, keep in mind the importance of randomisation. Third, selecting a model will depend on our question. For our Tesco question, we probably want to use market basket analysis. Fourth, we should test whether the changes we made due to our analysis actually resulted in higher profits. The important thing is to make sure you are really answering the question you asked in the first place.
This is a specific example, but the basic thought process can be applied to your own project. Good luck! Please message us through Zulip if you need more guidance.
What the beginner thinks
“Where to start? There are so many questions waiting to be asked - how can I possibly choose one?”
My recommendation is to start with this market basket analysis example. It’s a really easy one to understand. Go through the thought process of designing a project that would answer the Tesco question. Even go online to see what data sources are available. Once you go through this, you’ll be more comfortable with the approach. For your own project, choose something near and dear to your heart. My grandfather had Parkinson’s disease, so one of the first projects I did asked the question: can data science be used to detect Parkinson’s disease ahead of an actual diagnosis? If you pick something you care about, you’re likely to put in more effort and do better.
References
Day 17: Data Cleaning
Author: Ximin Chen
“I kind of have to be a master of cleaning, extracting and trusting my data before I do anything with it.” - Scott Nicholson
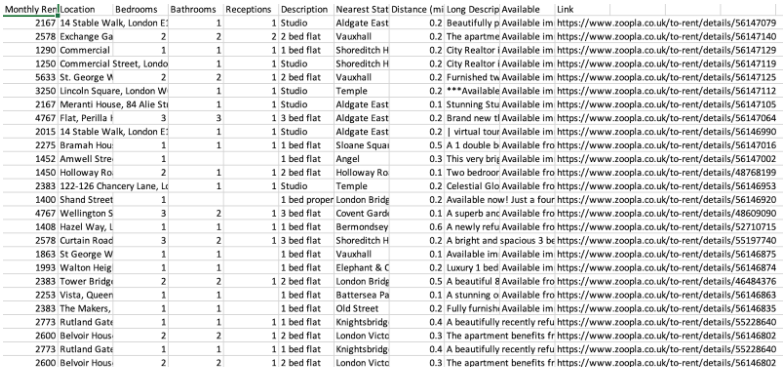
Data cleaning is an important first step in any data science project. It is the process of dealing with data points that are incorrect, inaccurate or incomplete, before we perform any further analysis. I will be walking you through some of the steps in data cleaning, using a dataset of rental listings scraped from Zoopla.
Missing data
Check for null values across the columns of the dataset. There are 2 ways to deal with missing data - drop or impute.
In our dataset, rows with no rent price are dropped, since we are interested in predicting rent prices. It was found that listings that are ‘Studio’ or ‘Rooms’ (meaning a single room is for rent, not the whole property) have missing values in the Bedrooms column. These rows are not dropped - the empty Bedroom values are filled in with 0 and 1 respectively. For apartments with missing value for Receptions, these are filled in with 1, which is the typical number for Receptions in apartments.
Outliers
Depending on how you define outliers, you may want to drop these rows unless they provide valuable information. In our case, rows with more than 5 bedrooms or 5 bathrooms are dropped.
Errors
Sometimes, values can appear with typos, inconsistent formats or different units. For example, in the Bedrooms column, some values were spelled out (e.g. ‘four’). It is important to ensure that these differences are standardized, for ease of analysis in later stages.
Irrelevant data
There could be irrelevant columns or duplicate rows in the data. It is best to remove these points to focus on those that are the most relevant. If you require data from multiple tables, it is also a good idea to merge them. For example, latitude and longitude data for the listings were separately obtained in another table, then merged with the current data set as additional columns.
Conclusion
I have introduced some of the key things to look out for in cleaning a dataset. Ultimately, how you clean the data depends on the state of your dataset and what you intend to do with the data. However, it definitely is a crucial step in any successful data science project, so do pay attention to it!
Day 18: Data Exploration
Author: Harish V
“If you do not know how to ask the right question, you discover nothing.” - W. Edward Deming
After cleaning our data, we would need to explore it to understand its main characteristics and try to get a preliminary sense of some of the relationships that exist in the data. EDA, or Exploratory Data Analysis, can help us make sense of our data and identify patterns. It is especially helpful for large datasets which you are not familiar with. Also, such an exploration of the data will facilitate and improve one’s ability at asking relevant questions from the data at hand.
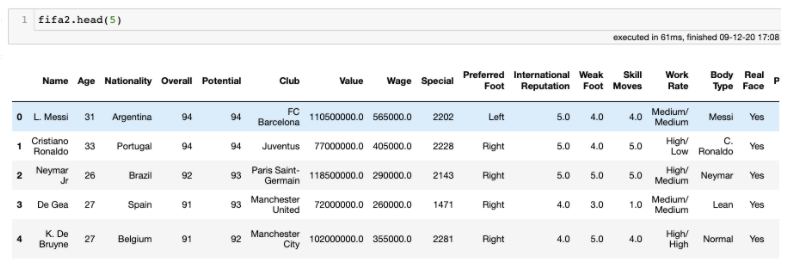
In this post, I shall provide some examples of EDA techniques using the FIFA-19 players dataset from Kaggle. This dataset contains detailed information on every player registered in the FIFA-19 database and can be accessed here.
General Overview
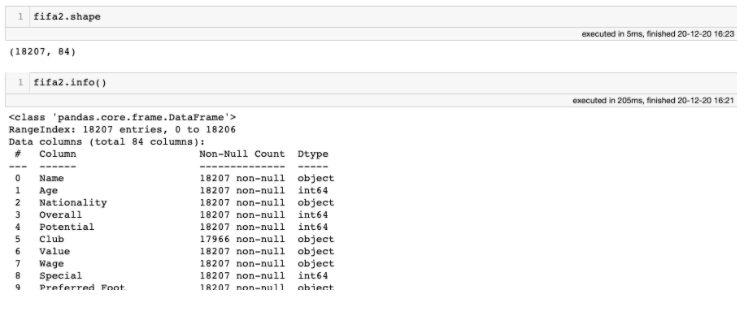
We will first begin with a general overview of the data and get some descriptive statistics. The shape function and the info() function can be used to look at the dataset’s dimensions, and identify the features it contains and its types. We can see that there are 18207 players and 84 attributes.
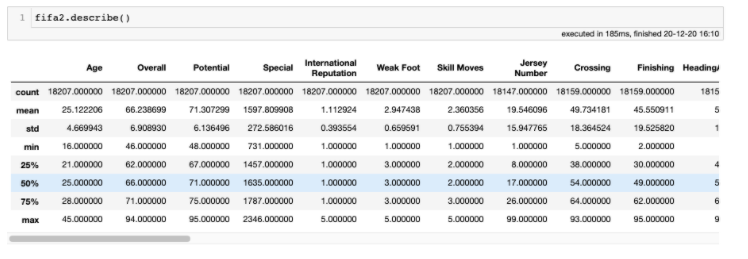
The describe() function provides descriptive statistics that summarize the distribution of numerical columns. Information such as the count, mean, standard deviation and quartiles is returned.
After getting a broad overview of the data, we can move on to generating visualisations of our data.
Univariate Visualisations
Univariate visualizations are any visualizations where there is only a single variable involved.
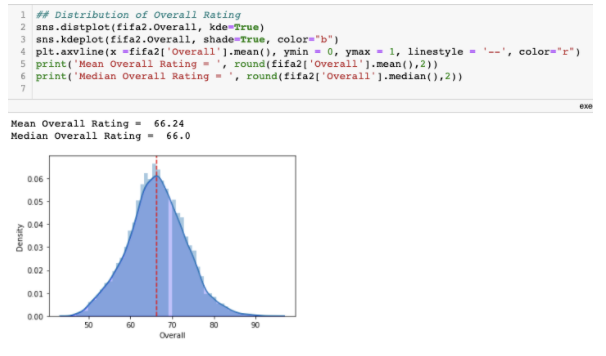
For example, using a histogram, we can see that the overall ratings of players resembles a normal distribution, and the mean rating of players is 66.24. It is clear that only a small minority of players have ratings above 90.
Multivariate Visualisations
These allow us to analyse 2 or more variables at the same time.
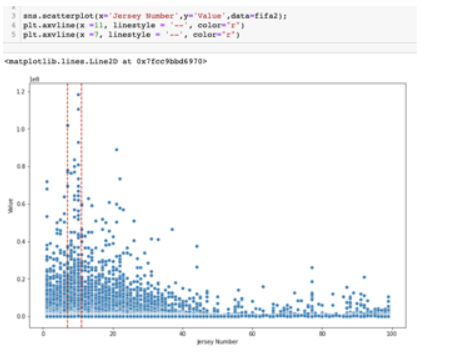
Scatterplots and joint plots can be used when analysing numerical columns. For example, plotting a player’s value against their Jersey Numbers reveals that most players prefer lower numbers, and that players with the highest valuations prefer the numbers 7-11.
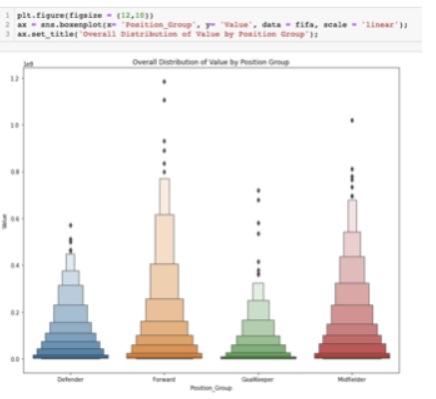
When comparing a categorical column with a numerical one, we can use violin plots and categorial box plots. In this example, using a boxen plot to plot the distribution of a player’s value by their position group shows that goalkeepers tend to have slightly lower valuations.
Conclusion
The above mentioned steps scratch just the surface of what is an incredibly broad topic. Data exploration is to treated as if it were a kind of art. There is always going to be heavy reliance on your intuition and domain knowledge when performing this step.
References
- Comprehensive data exploration with python
- An Extensive Step by Step Guide to Exploratory Data Analysis
Day 19: Building Models
Author: Mun Fai
“Computers are able to see, hear and learn. Welcome to the future.” - Dave Waters
To know which model to use, we should first differentiate between supervised and unsupervised learning. For supervised learning, the model learns using labelled data. Think of labels as an “answer” about the data. Hence, if we are building a model to predict if a person is likely to be unemployed given his characteristics (e.g. education, race and gender), the input data should include a variable to indicate whether an individual is unemployed. When shown another person, the model will compare it to the labelled dataset to make predictions of unemployment.
Within supervised learning, people tend to focus on regression and classification. Regression looks at continuous variables such as predicting for the price of ice cream when demand rises in summer. On the other hand, classification looks at discrete variables - we are concerned if something falls within a certain class. In practice, both regression and classification models are rather similar.
For unsupervised learning, the data is unlabelled. Hence, the model does not know the correct ‘answer’. Instead, it will just try to extract patterns from the data. A common example of unsupervised learning is clustering. The model looks at different data points and groups those that are similar to one another together. Another example of unsupervised learning is anomaly detection. This is commonly used in predicting credit card fraud. The model tries to ‘understand’ a customer’s spending habits and will flag out any anomalies that may be indicative of fraud.
What the Beginner thinks
Whilst there are many models to choose from, the foremost task is to use the right tool for the right job. Understand what data science problem you are facing and there will be a variety of tools you can tinker with. Sckit-learn on Python is a good starting package as it contains many common models along with tutorials on how they work and how to use them.
References
Day 20: Presentation of Your Project
Author: Ramshankar Yadhunath
“Just because you analyzed a ton of data does not mean you need to show a ton of data” - Cole Nussbaumer Knaflic
Presentation is a very important part of the data science lifecycle. It is in this step where value is delivered to the stakeholders. In the context of a project, this is the step where you showcase the finds and results of the work put in.
There are different ways to present your project based on the type of project. If the project involves only data analysis, then you could choose to present a report of your finds or create a static dashboard. If the project involves generating predictions or the classification of samples, then an application deployed as a website could be a potential choice of presentation.
Why and where to present a project?
Presentation of projects will also help build one’s portfolio and thus increase chances of employability. A very common platform to share projects is Github. In fact, several data scientists use Github to build their data science portfolio. Writing blog posts explaining your project would be well-received as the act of technical blogging depicts a deep passion for the subject. If you want to take things up a level higher, you could even build your own website to showcase your work.
Kaggle is a highly relevant platform if you want to be amidst a learning and thriving data science community.
Summarizing your project
There is a considerable difference between the task of doing a data science project and making it palatable to your stakeholders. Many a time, stakeholders are not interested in the specifics of your ML algorithm. Rather, it is more important to them to know whether the solution you present could be valuable to them. This is where the art of presentation and making good analytical reports comes into play. Always remember that it is never about what you know or what you did. It’s always about what value your work puts on the table.
What the beginner thinks
“My project is too basic. I don’t think this needs to be presented.”
Well, I would agree with you on this only if your project is a plagiarized version of somebody’s work. Otherwise, it makes no sense to hold back. There is no such thing as a universally-accepted project. Every project is different, right from the motivations of the creator to the reception by stakeholders. Therefore, the key is to get over the impostor syndrome and get working. If you are still confused about this, all you need to know is that - “Only one part of a data science project matters - The part where you can deliver value to someone”
References
- How to properly present a Data Mining project - KDNuggets
- Chapter 11. Producing effective presentations - Practical Data Science with R (manning.com)
- The Ultimate Guide to Deploying Machine Learning Models - ML in Production
- Low Tech SUPER POWERS for Data Storytelling - YouTube
- Some Best Practices for Analytics Reporting - John Miller
- Storytelling with data